Overview of Business Dashboard
This business dashboard provides a bird’s-eye view of your bookkeeping activities, allowing you to easily track the progress of automated data entry for your documents and quickly identify tasks that need completion.
Document Type Counts
At the top of the dashboard, you will find document counts, which give a quick overview of documents and their processing stages.
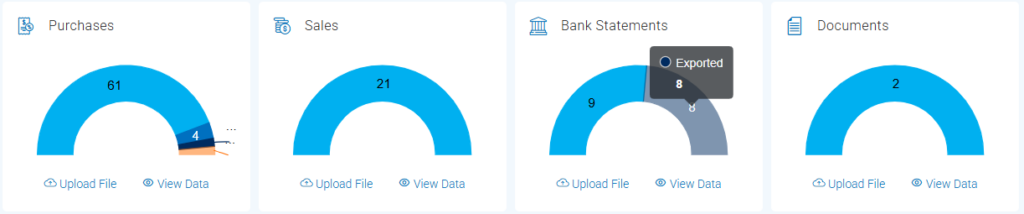
You can click the ‘View Data’ link below the “Document Status Counts” to view the list of documents, or click the ‘Upload File’ button to upload additional documents for processing.
Income and Expense by Month
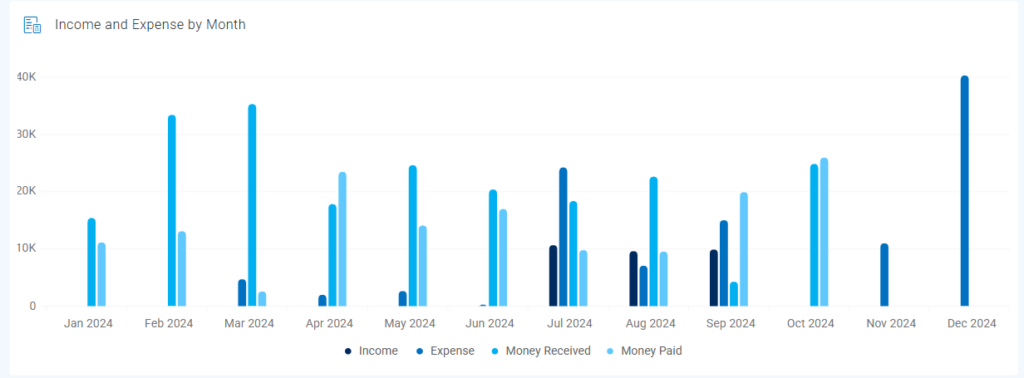
This bar chart visualises your financial trends for the last 12 months by plotting four key metrics month by month:
– Income: Calculated from your uploaded PDF sales documents.
– Expenses: Calculated from your uploaded PDF purchase documents.
– Money Received: Derived from incoming transactions in your uploaded PDF bank statements.
– Money Paid: Derived from outgoing transactions in your uploaded PDF bank statements.
This allows you to track changes over time and compare operational results (Income/Expenses) with cash movements (Received/Paid).
– The data shown excludes any documents flagged as ‘Error’ or ‘Duplicate’ during processing.
– All amounts shown are converted to your business’s base currency for consistent comparison.
Bank Transactions Summary by Month
By default, this chart displays your bank transaction activity for the last 12 months, providing a clear view of your cash flow month by month. It combines:
Bar Chart:
– Money In (Dark Blue Bars): Represents the total funds identified as received into your bank accounts each month, based on your uploaded PDF bank statements.
– Money Out (Light Blue Bars): Represents the total funds identified as paid out from your bank accounts each month, based on your uploaded PDF bank statements.
Line Chart:
– Balance (Light Blue Line): Shows the net cash flow for each month, calculated as ‘Money In’ minus ‘Money Out’. A positive balance indicates more money came in than went out during the month, while a negative balance indicates the opposite.
This chart helps you quickly visualise your monthly cash position and identify trends in inflows and outflows.
Expenditure Trend
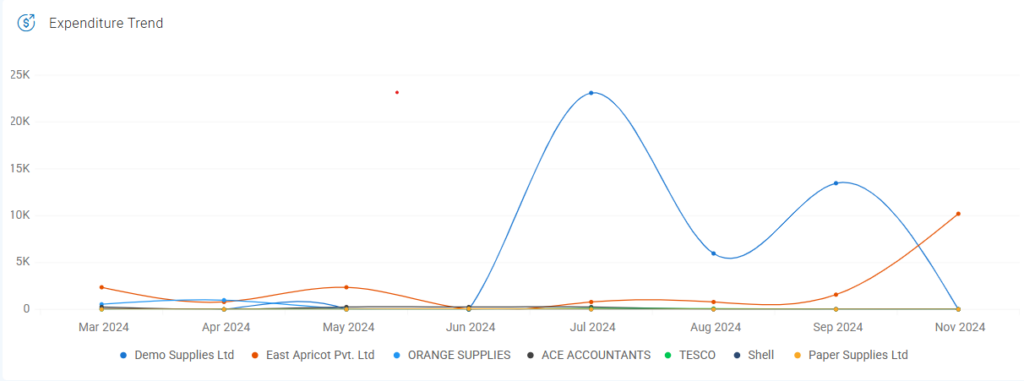
The line chart tracks expenditure trends for the top ten suppliers over the past twelve months. It helps you identify trends in your expenses and easily spot missing documents or inconsistencies.
For instance, if the chart shows a decreasing expense trend for a particular supplier, you should review whether bills from that supplier are being received regularly.
Each colored line on the chart represents the total amount spent with a specific supplier each month.
Data Source: The expenditure amounts are calculated from the PDF purchase documents you successfully processed and uploaded.
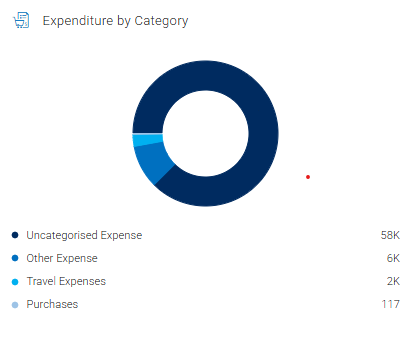
Expenditure by Category
This donut chart visually summarises your total expenditure distributed across different expense categories. It allows you to quickly understand the main areas of your spending at a glance.
Data Source: The expenditure figures are calculated based on your successfully processed, uploaded PDF purchase documents (such as bills and receipts).
Sales Trend
The line chart tracks your sales trends over the past twelve months. It helps you identify patterns in your sales activity so you can easily spot missing records or inconsistencies.
For instance, if the chart shows a sudden drop in sales for a particular month, you should review whether all sales documents have been properly uploaded.
Each colored line on the chart represents the total sales recorded each month. Sales records that have been deleted are marked with a dark blue line.
Sales by Category
This donut chart visually summarises your total income distributed across different sales categories. It allows you to quickly understand the main sources of your revenue at a glance.
Data Source: The sales figures are calculated based on the successfully processed PDF sales documents (such as sales invoices) you uploaded.
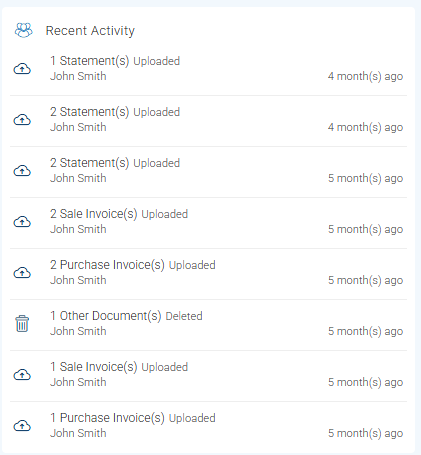
Recent Activity
On the right-hand side of the dashboard, you will find the Recent Activity section. This section provides a real-time log of the latest actions performed within your Receipt Bot account related to document processing. It lists events such as document uploads, exports to your accounting software, and deletions, along with the time elapsed since each activity occurred.
This feed helps you stay informed about ongoing operations and track recent document movements within the system.
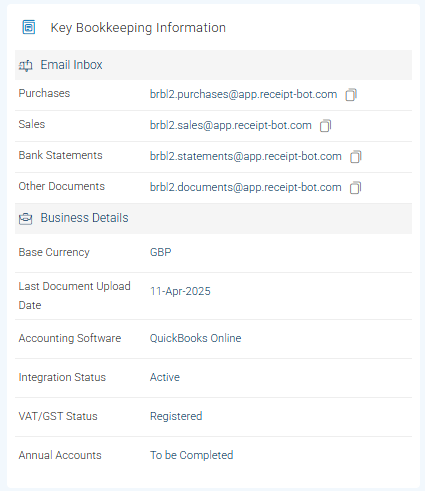
Key Bookkeeping Information
The ‘Key bookkeeping’ section provides crucial information related to a business, including a document inbox, base currency, integrated accounting software, VAT registration status, and key accounting dates relevant to the business.
It’s divided into two main parts:
– Email Inbox: These are dedicated email addresses provided by Receipt Bot for submitting your documents directly via email. You can easily copy any email addresses by clicking the copy icon. This simplifies forwarding emails with attachments or setting up rules in your email client.
– Business Details: These are quick references for your core account settings, displaying your business’s Base Currency used for reporting, the Last Document Upload Date, the specific Accounting Software connected (e.g., QuickBooks Online), and the current Integration Status confirming the connection health.
For further details, please refer to the following article: Setting up Auto-Forward Emails for Bills Recording.